The IEM web application manual
Description of the service
Stability of a protein results from a delicate enthalpy–entropy compensation. This application evaluates the energetic contributions of individual amino acid residues to the native state of a protein in the form of the Interaction Energy Matrix (IEM) [1]. In this model, residues whose net interaction energies are strongly stabilizing (negative) are expected to be critical for the total stability of the protein [1,2]. Such residues are also often found to be evolutionarily conserved, a feature which can be revealed by the study of multiple sequence alignments (MSAs) of evolutionarily related sequences. This application provides tools that can be used to identify amino acid residues in the 3D structures of proteins which display energetically or evolutionarily distinguishing characteristics. Such residues can be of interest, e.g., for protein engineering or mutational studies.
Overview of the user interface
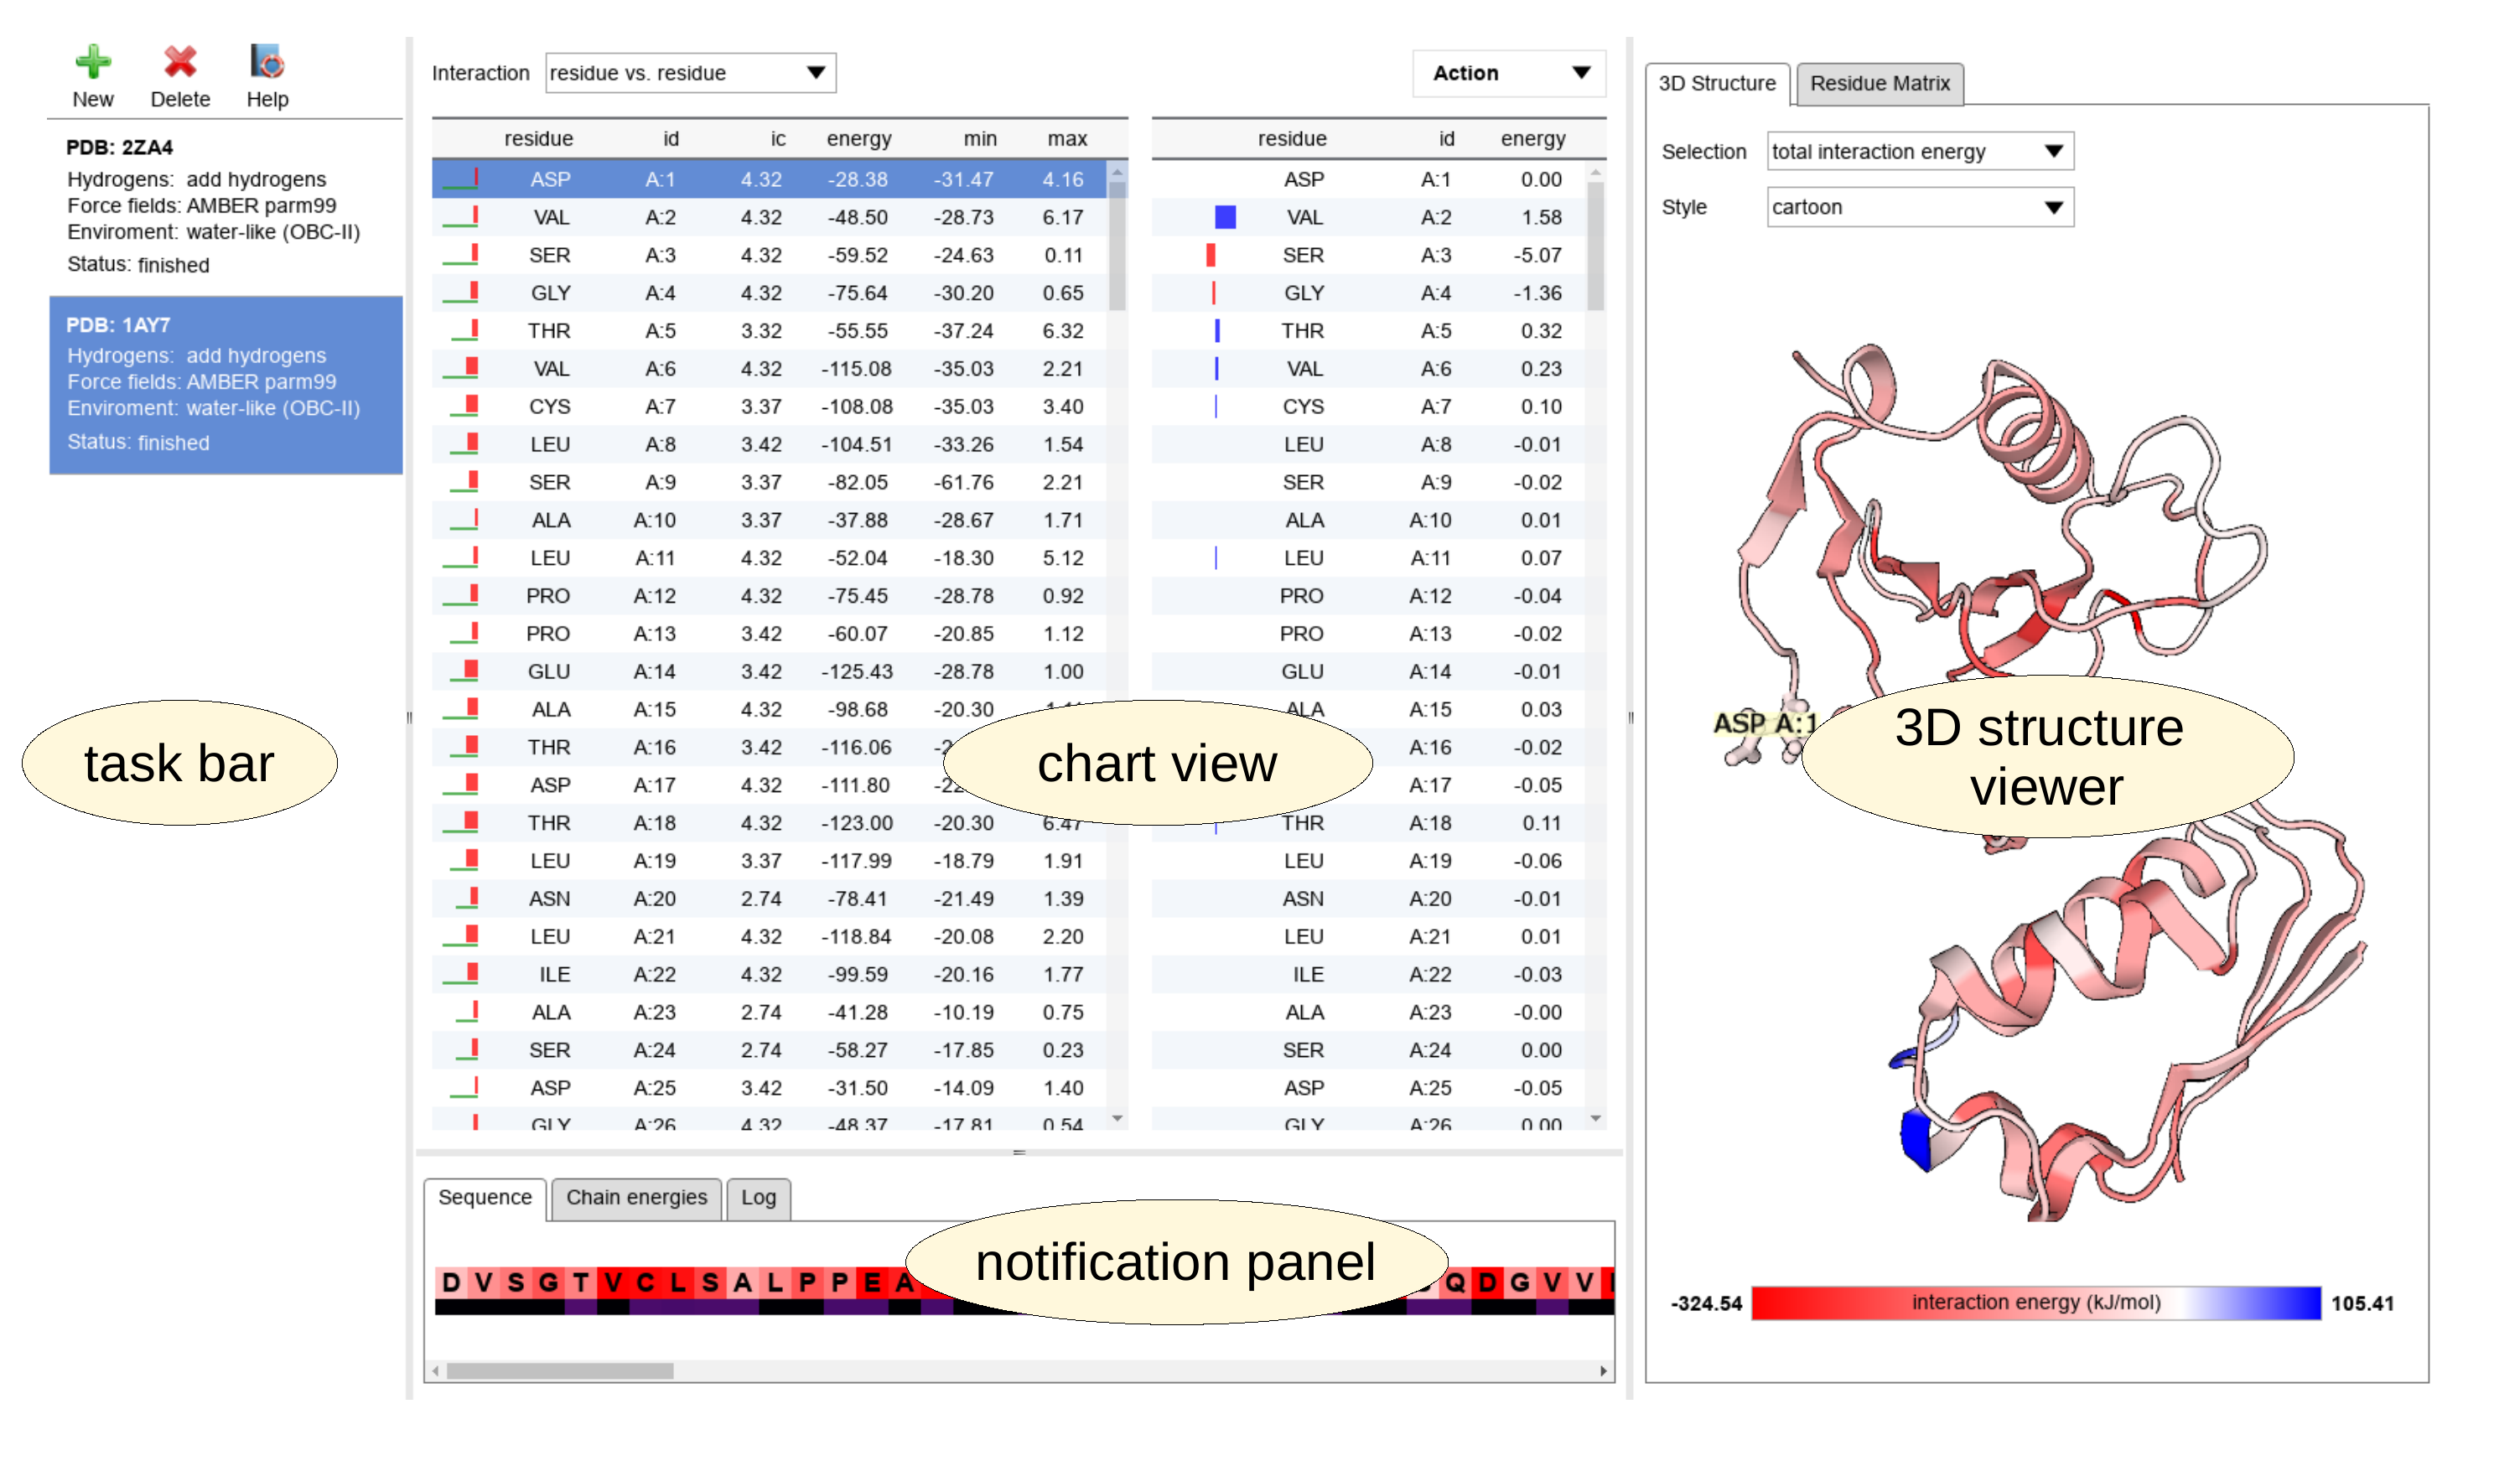
The user interface of the application consists of four panels - the task bar on the left side, chart view in the middle, interactive visualizers on the right and the notification panel in the bottom area. The interactive visualizer consists of 2 tabs - the 3D structure viewer and the Residue matrix viewer. The size of the individual panels is completely adjustable and the user can adapt it for effective utilization of the screen.
Unless a new task is submitted, the panels show no information. Nevertheless, when the application starts, the user is prompted to start a task by a submission dialog. This dialog is preset to submit an example calculation if accepted directly without any changes.
After processing and all calculations are completed, the results are presented to the user both in chart view and interactive viewers. Additionally, the IEM matrices can be exported or inspected in tabular form. This actions are available from "Actions" drop-down menu at the top of chart view panel.
Several independent task can be analyzed and visualized in the same time. The application allows to use the "New" button any time to start a new task. Any task can be removed by pressing the "Delete" button in the task bar panel. Switching between individual tasks is achieved simply by clicking on the task label in the task bar panel.
The submission dialog and parameters of the IEM calculation
The submission dialog can be raised any time by pressing the "New" button at the top of the task bar in order to submit a new calculation. Afterwards, a new panel appears and provides several options for submission, preprocessing of the input three-dimensional structure and calculation of interaction energies:
The input structure can be downloaded automatically from Protein Data Bank (default) or provided by the user. In the first case, the user is allowed to type any valid PDB Identifier into the corresponding input box. In the other case, a PDB file containing the protein structure can be loaded via standard file opening dialog after pressing "Select a file" button.
Importantly, the calculation of the IEM requires full-atom resolution of the provided structures including hydrogen atoms. However, they are often missing in X-ray structures from Protein Data Bank. For convenience, the missing hydrogen atoms can be added by the Reduce program (default)[3]. Addition of hydrogen atoms is highly recommended and it is a safe choice for all structures from Protein Data Bank even if hydrogen atoms are present in the structure file. On the other hand, if a structure obtained from a modeling software or a computer simulation is submitted, the hydrogen atoms are usually there and their position might be of interest. Unfortunately, the hydrogen addition step can accidentally duplicate hydrogen atoms if their naming deviates from Protein Data Bank standards. In these cases, the hydrogen addition feature can be deactivated in "Hydrogens mode" select.
Force field for calculation of interaction energies can be chosen in the next select ("Force field"). The current version of the application supports 4 broadly used force fields, namely OPLS-AA [4], CHARMM 36 [5], AMBER FF99 (default) [6] and AMBER FF03 [7]. All force fields are suitable for description of interactions in biomolecules. Nevertheless, the user is encouraged to consult the literature what is the best choice for the studied molecule.
Finally, the last select ("Environment") decides whether the calculation of interaction energies are treated in environment independent manner ("gas phase") or the effects of aqueous solvent is modeled in implicit fashion ("water-like (OBC-II)"). In the latter case, a variant of generalized born implicit solvent model is applied on calculation of electrostatic interactions, which screens their magnitude due to solvation effects. Currently, the Onufriev-Bashford-Case parametrization II (OBC-II)[8] is employed and the previous version of distance-depended dielectric constant solvation model("water-like (DDDC)") got deprecated, but it is still maintained for sake of backward compatibility. However, it should not be used for new calculations, since the newly implemented generalized born implicit model provides better and physically grounded approximation of solvent effects at cost of minor computational overhead. Usage of the solvent model is recommended and set as default. In the gas phase calculations, the magnitude of interactions between charged species dominates the IEM, what does not reflect their importance in natural environment of the biomolecules.
Chart view panel
Two interactive charts dominates the chart view panel. The left chart presents the name and unique identification of the residue (id) and informational content (ic), which is a measure of conservation of the residue at individual positions of the sequence. Please be aware that large IC values are also often exhibited by the chains' terminal residues, as these can remain unmatched in the MSAs. The total (net) interaction energies (energy) for the individual residues follows accompanied by simple statistic measures such as minimal and maximal contribution to the particular net interaction energy. The lowest value of the interaction energy between a pair of residues (min) indicates the strongest pairwise interaction of the residue. On the other hand, the highest, the most destabilizing interaction (max) might reveal an energetically unfavorable arrangement of residues or a problem in the structure. Additionally, the magnitude of total interaction energy of individual residues is visualized graphically by bars at the left border of the chart. The stabilizing total energies are coded in red and the destabilizing in blue color. The green bar bellow shows information content of the residue.
Selecting a line in the left chart set a reference residue(s). More residues can be selected by the mouse actions with simultaneously pressed Ctrl or Shift key. Automatically, the right chart shows the individual interaction energies (energy) between the reference residue(s) in left chart and the other residues in the structure, listed with their name and unique id.
All atomic pairwise interactions between amino acid residues are included in the calculation in default setup. However, for specific purposes, they can be decomposed into backbone- and side-chain related contributions. Such separation results in six additional energy matrices which can be accessed easily by the drop-down menu "Interactions" in the upper part of the chart view panel. This setting is global and the changes are immediately applied on all interaction energies shown in all panels.
Additionally, the atomic pairwise interactions can be further decomposed into separate Coulombic and Lennard-Jones components. This option is accessible by the drop-down menu "IE component" in the upper part of the chart view panel. Similarly as for the "Interactions" menu, the changes affects immediately all interaction energies presented in all panels.
A click at the header of any chart enables two modes of sorting according to the selected column, in ascending and descending order, respectively. Both charts are also interactively connected with the 3D structure viewer and the Residue matrix viewer. The selected reference residues highlight it in the 3D structure viewer and their pairwise interactions are shown in the corresponding visualization mode ("Selection:pairwise interaction energies"). Similarly, the selected residues can be individually inspected in Residue matrix viewer, if an user defined selection mode is active (Residues:selection option is chosen).
The 3D structure viewer
The structure viewer presents the whole submitted structure in a fully interactive way. the viewer allows focus and freely rotate the model. Two common graphical representation of biomolecular structures are available - "cartoon" with schematic depiction of secondary structure elements and "tube" focusing on the trace of the backbone. These styles can be switched using the drop-down menu "Style" at the top of the panel. The colors are coding different information according to the option selected in the drop-down menu "Selection". Three modes are currently available. The first one - "total interaction energy" assigns the color to each residue by its total (net) interaction energy. The stabilizing interactions in shown red, repulsion in blue. In this mode, the most stabilizing residues can be identified on the model visually, because the colors are saturated according to the strength of the interactions. The "pairwise interaction energy" mode assigns the colors in relation to the reference residue and the saturation of the color indicates the strength of the individual pairwise interactions between the reference (in green) and other residues. Finally, the display of evolutionary conservation of individual residues can be toggled by selecting the option "conservation" in the "Selection" drop-down menu.
The color bar at the bottom part of the panel shows the range of values and their color coding. The limits can be adjusted arbitrarily in the "Action:Configure" panel. Settings in this panels allows the user unifying of color scales across the analyzed jobs.
The Residue matrix viewer
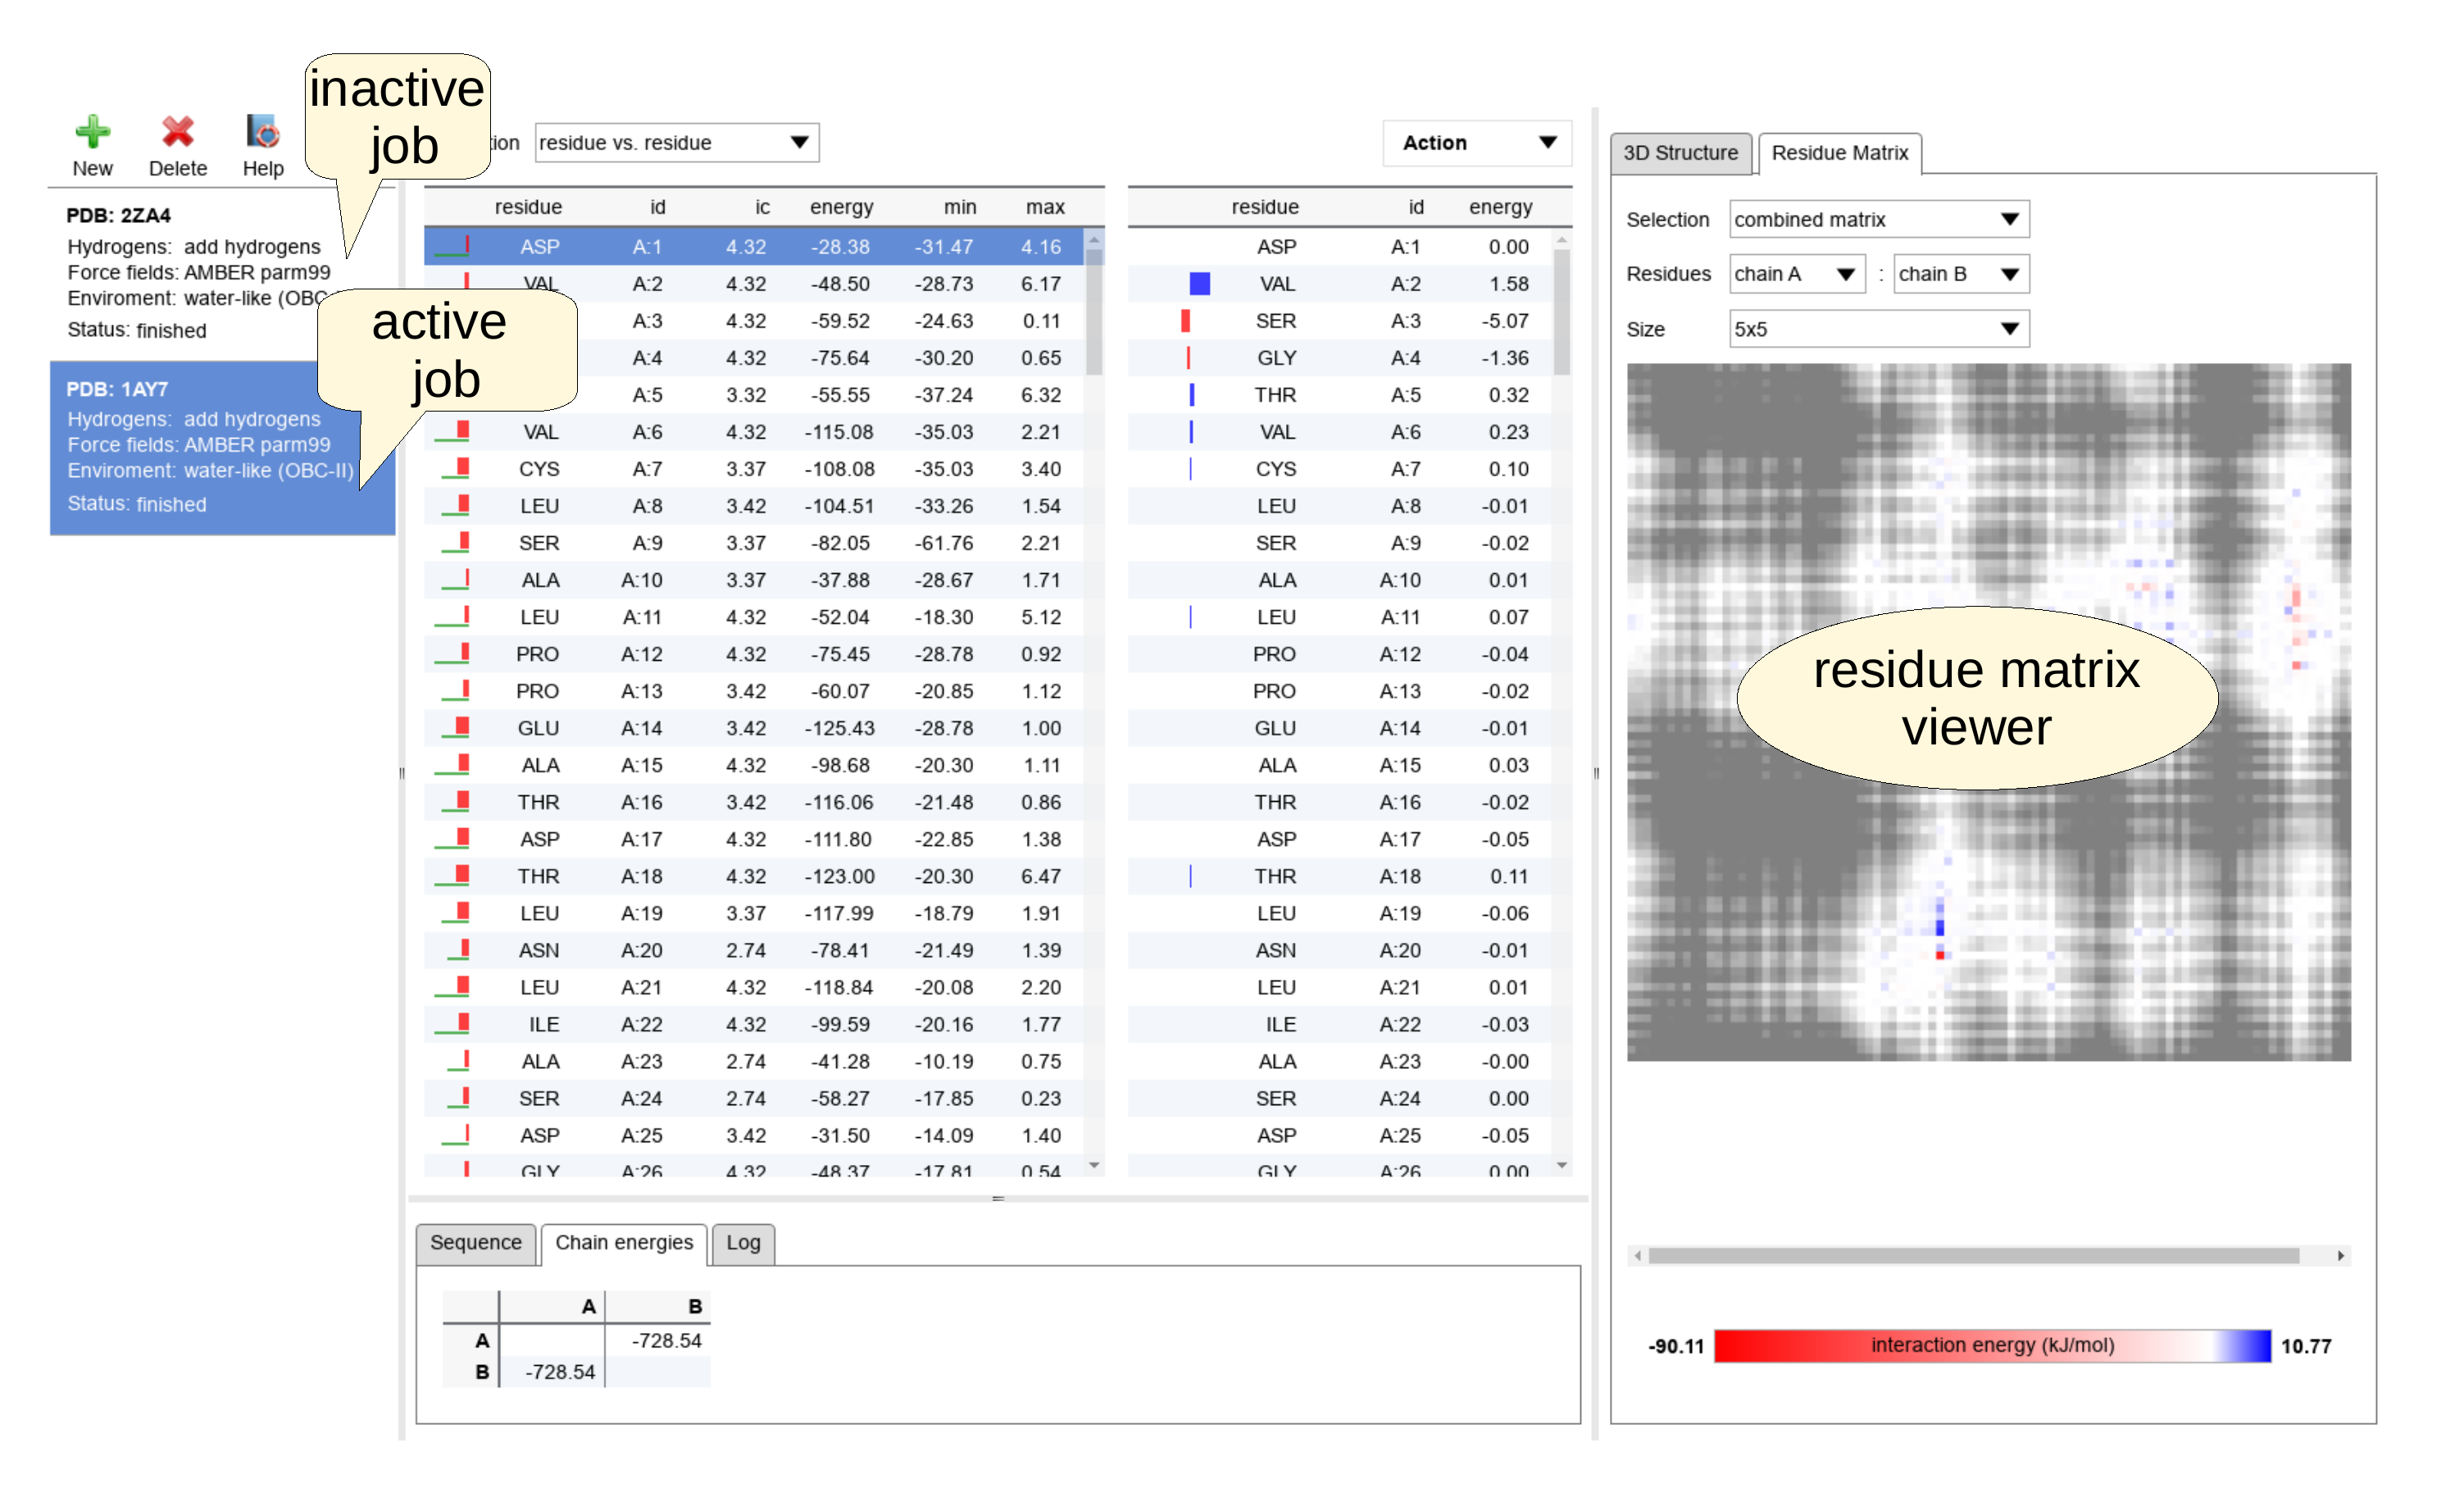
This interactive panel represents IEM graphically as a matrix of points. The size of the point corresponding to a single interaction is controlled by the "Size" drop-down menu at the top part of the panel. At the beginning, the size of the points is chosen automatically, but the user is allowed to magnify or reduce the resolution. The meaning of color representation depends on the kind of the plotted matrix chosen by "Selection" drop-down menu. The option "combined matrix" provides an interaction energy matrix enhanced by the distance (proximity) measure. In this mode, the attractive interactions are shown in red, the repulsive in blue and their strength is indicated by saturation of the color. Additionally, the distance of the residues is coded in the shades of gray. The close residues are plotted in light and the shade darkens with increasing distance. The next option "energy matrix" omits the distance information and provides simple energetic view. Finally, the last option, "distance matrix", focuses only on inter-residue distances. It shows the closest distance between residues and can be employed for analysis of geometric contacts between residues.
The range of residues, which are displayed in the matrices can be specified in the "Residues" drop-down menu. If multiple chains are detected in the provided structure, they are automatically added as options in this menu. There are always a options "all" and "selected", which includes all residues and a selected set of residues picked in the left chart of the chart part, respectively. The selections can be done independently for both axis of the matrix. This facilitates, for example, a convenient detection of interaction residues at the interface of two chains.
The detailed information about the interactions and distances plotted in the matrices are available interactively by pointing the mouse cursor at the area of interest. The label describing involved residues and the numeric values of energy and distance is shown accordingly.
The range of the actual color scales used in the visualizations are always displayed in the color bar at the bottom part of the panel. The ranges can be customized in the "Action:Configure" panel.
The scatter plot viewer
The scatter plot viewer allows straightforward correlation of the interaction energies with the information content (conservation) of the selected residues. The scatter plot is interactive and provides additional information on data points, if a point is selected or hovered by mouse pointer.
The set of plotted residues is controled by "Residues" drop-down menu. The available choices involve the individual chains and the residues selected manually in the chart view ("selection"). Additionally, the data points can be labeled according to the choice in the "Labels" drop-down menu. Available options include "none" (default), residue number ("id"), residue name ("residue") and the combination of the two former ("residue + id"). The setting is persistent and propagates to the next sessions.
The configure panel
The configure panel can be accessed from "Action" drop-down menu at the top part of the chart view. The panel controls adjustments of the color scales. If "relative values" are selected in the "Scale mode" drop-down menu, the color scale is adjusted automatically to cover the whole range of calculated energies. However, if a constant color scale is needed, for example for comparison of different molecules, "absolute values" option can be selected. It enables the other fields in the dialog, which can be edited manually in order to set the range for total (net) interaction energies as well as limits for pairwise interaction energies.
The panel provides also settings for distance calculations and visualization in the Residue Matrix viewer. The drop-down menu "Definition" controls the way, how the distance is calculated. The currently supported algorithms are the closest distance of any pair of atoms between two groups ("nearest atoms") or the distance is calculated between the corresponding centers of mass ("center of mass"). The "Max distance" field controls the upper limit for calculation of distance matrix in "distance matrix" mode, the "Min mask distance" and "Max mask distance" values control the darkening of the gray scale in the "combined matrix" mode.
The settings in this panel affects all jobs and the changes are instantly applied to all color scales in the application. The user settings are stored as cookies and are loaded automatically during a next start of the application.
The task bar
The task bar manages the individual jobs, which are handled in a single instance of the application. A new job can be submitted by the "New" button at the top of the panel. Analogously, an active job is removed by "Delete" button. The deleted jobs cannot be restored, because no data are recorded and stored at the server side of the application. The button "Help" accesses this manual.
The individual jobs are represented by fields in the task bar, which show the details of the submission (name of the PDB file a parameters for calculation of interaction energies). An active job is highlighted in blue. The activity of jobs switches intuitively by clicking at field that represents individual submissions. Nevertheless, all calculation are performed in background and the job does not need being active to be finished. Moreover, other jobs might be submitted at the same time without waiting on the end of the previous submission. The progress of the processing is immediately and continuously indicated by status bar in the corresponding field in the task bar. Simultaneously, the notifications and messages from the tool chain are broadcast and presented in the notification panel ("Log" tab).
Notification panel
The notification panel presents various additional information. It currently consists of the tabs. The tab "Sequence" shows the color-annotated sequence found in the submitted structure. The colors encode the total (net) interaction energy of the residues as the red-blue color scale. The information content (conservation) is analogously presented as colored bar below. The mapping of both color scales to numeric values is presented by two color bars in the bottom part of the panel.
The "Chain energies" tab presents table of inter-chain interactions energies, if there is more than a single chain in the submitted structure. The values represent the sum of interactions energies between residues in different chains. This feature is useful for calculation of interaction energies between components of biomolecular complexes.
The "Log" tab collects a verbose log of various actions of the application, mostly processing and interpretation of submitted structures. It is useful for tracing problems in the workflow and bug reports. This log is not stored at the server, if a support is needed, please, provide us the content of this panel.
Export of IEM
The IEM can be saved for a further user analysis by the "Action:Export IEM" command. Currently, the supported format is a compressed csv (comma-separated values). The file is quickly prepared for download and offered to the user. The content involves 4 interaction matrices, which are sufficient for reconstruction of any possible combination of interaction modes (residue-residue, backbone-backbone, side chain-side chain and backbone-side chain).
The units and color conventions
The interaction energies are reported as kJ/mol in all cases. Negative values indicate stabilizing interactions and the positive values repulsion. The interaction energies are consistently visualized in red-blue color scale, where the saturation corresponds to the strength of the interaction. The red color states for attractive and stabilizing interaction, whereas the blue is reserved for repulsive and destabilizing ones.
The information content (IC) values range between 0.0 bits (no conservation) and 4.32 bits (complete conservation). The values of IC are coded in an orthogonal color palette to avoid any misinterpretation. No conservation is presented in yellow, and the color scale transforms progressively to black with increasing IC. Please be aware that large IC values are also often exhibited by the chains' terminal residues, as these can remain unmatched in the MSAs.
Methods
Processing of the input PDB files
If hydrogen addition is enabled, the submitted PDB file is firstly processed by Reduce program (version 3.23)[3] to add and optimize position of hydrogen atoms. Output of this tool is captured and interpreted by INTAA parser. If this preprocessing step is disabled, the submitted PDB is directly parsed by INTAA. The internal input parser can deal with various atom-naming conventions, which might be used in various software or force fields, and can deviate from Protein Data Bank standards. The only condition for successful recognition is a proper assignment of atoms in residues, sensible geometry, element symbol or at least an atom name, which allows the interpreter guess the chemical identity of the atom. Firstly, the matching of standard atom names defined in the latest PDB standard is attempted. If it fails, the naming convention of the selected force field is probed instead. As a last option, the chemical topology in the structure is constructed according to the provided or guessed atomic identities. This topology is compared to the internal database of known residues and if a match is found, the force field parameters are correctly assigned to individual atoms.
Calculation of interaction energies
The interaction energy matrices are constructed from interaction energies between predefined fragments. These fragments can be whole residues, their backbone and side-chains.
The interaction energy is calculated in standard approximation used by first class force fields. It consist of two physical components - van der Waals and electrostatic interactions. van der Waals interactions are treated by Lennard-Jones potential and the electrostatics by Coulomb's law between point charges centered at atomic positions. all required parameters are for calculations are obtained from the chosen force field. If the solvation effects are considered, the effective Born radii of individual atoms are first calculated according to the method introduced by Onufriev, Bashford and Case[8]. Afterward, the calculation of pairwise electrostatic interactions is enhanced by the screening terms, which takes into account the effective Born radius and hence an exposure of the atom to the solvent. The detailed description of the solvation terms is available in ref [8].
Calculation of information content (evolutionary conservation)
After submitting a biomolecular structure, the PDB file is parsed using the Bio.PDB [9] module from the Biopython [10] package and sequences of individual chains are read. Only the first model in the PDB file is used. The polypeptide chains are then identified, and an MSA of similar sequences is constructed for each using the 'phmmer' tool from the HMMER [11] package. The 'phmmer' search uses default parameters and UniProtKB/Swiss-Prot [12] as the target database (currently, release 2020_05 is used). For each MSA, the respective weights of its constituting sequences are calculated using the Gerstein/Sonnhammer/Chothia algorithm [13] as implemented in the 'esl-weight' miniapp included with the HMMER software. Finally, the per-residue information content (IC) is calculated using the 'esl-alistat' miniapp, taking the individual sequence weights into account.
The source code carrying out these tasks is available at https://github.com/davidjakubec/INTAA-conservation.
Technical limitations
The INTAA server is intended as tool for an interactive work with submitted structures. A lot of effort was put in optimization of the workflow to achieve fast loading and instant response on user actions. However, if very large biomolecules or complexes of biomolecules with thousands of residues are submitted, the calculation can last up several minutes to be completed. Due to enormous amount of mutual interactions (scales as N2), also the response of the application might be affected on slower computers. For a performance reason, we recommend to not submit PDB files with more that 1000 residues.
Furthermore, if there are multiple models in the PDB file, only the first model is analyzed and presented in the application. Similarly, multiple atomic occupancy is not yet supported and only the first occurrence of the atom is considered.
Currently, all standard amino acids are fully supported in all force fields. The support for nucleic acid (DNA and RNA) is now experimental. In the next update, we plan to extend the support for the most common post-translationally modified residues and the most common constituents in x-ray structures in PDB (ions and small molecules).
Browser compatibility
The web server has been tested and confirmed to work with the following operating system/web browser combinations:
| OS | Chrome | Edge | Firefox | Safari |
| Gentoo Linux 17.1 | 86.0 | 78.4 | ||
| OS X 10.11 | 87.0 | 78.6 | 11.1.2 | |
| Windows 10 | 87.0 | 87.0 | 83.0 |
Example task submission
To submit an example task, press the "New" button at the top of the task bar panel, and then sent the task by pressing the "Submit" button. The example employs the 1UBQ PDB structure (with addition of hydrogen atoms), the AMBER FF99 force field, and the solvent environment. Alternatively, you can open the application with the already submitted example task directly by using this this link.
References
| [1] | Bendova-Biedermannova, L., Hobza, J., and Vondrasek, J. (2008) Identifying key residues in proteins using inter-residue interaction energy matrix. Proteins: Structure, Function and Bioinformatics, 72, 402. |
| [2] | Fackovec, B., and Vondrasek, J.,(2012) Optimal Definition of Inter-Residual Contact in Globular Proteins Based on Pairwise Interaction Energy Calculations, Its Robustness, and Applications. Journal of Physical Chemistry B, 116, 42, 12651-12660. |
| [3] | Word, et al.(1999) Asparagine and glutamine: using hydrogen atom contacts in the choice of sidechain amide orientation J. Mol. Biol. 285, 1735-1747. |
| [4] | Kaminski, G. a.; Friesner, R. a.; Tirado-Rives, J.; Jorgensen, W. L. J. Phys. Chem. B 2001, 105, 6474–6487 |
| [5] | Best, R. B.; Zhu, X.; Shim, J.; Lopes, P. E. M.; Mittal, J.; Feig, M.; Mackerell, A. D. J. Chem. Theory Comput. 2012, 8, 3257–3273 |
| [6] | Hornak, V.; Abel, R.; Okur, A.; Strockbine, B.; Roitberg, A.; Simmerling, C. Proteins: Struct., Funct., Bioinf. 2006, 65, 712–725 |
| [7] | Duan, Y.; Wu, C.; Chowdhury, S.; Lee, M. C.; Xiong, G.; Zhang, W.; Yang, R.; Cieplak, P.; Luo, R.; Lee, T.; Caldwell, J.; Wang, J.; Kollman, P. J. Comput. Chem. 2003, 24, 1999–2012 |
| [8] | Onufriev, A.; Bashford, D.; Case, D. A. Proteins: Struct., Funct., Genet. 2004, 55, 383– 394 |
| [9] | Hamelryck,T. and Manderick,B. (2003) PDB file parser and structure class implemented in Python. Bioinformatics, 19, 2308–2310. |
| [10] | Cock,P.J.A., Antao,T., Chang,J.T., Chapman,B.A., Cox,C.J., Dalke,A., Friedberg,I., Hamelryck,T., Kauff,F., Wilczynski,B. and de Hoon,M.J.L. (2009) Biopython: freely available Python tools for computational molecular biology and bioinformatics. Bioinformatics, 25, 1422–1423. |
| [11] | http://hmmer.org/ |
| [12] | The UniProt Consortium (2019) UniProt: a worldwide hub of protein knowledge. Nucleic Acids Res., 47, D506–D515. |
| [13] | Gerstein,M., Sonnhammer,E.L.L. and Chothia,C. (1994) Volume changes in protein evolution. J. Mol. Biol., 236, 1067–1078. |